Metrics
ErgZone tracks dozens of metrics, from basic performance numbers to advanced analytics — all designed to help you understand your effort and output.
- View core metrics
- The metrics you choose appear both in realtime during the workout and in the results screen, so what you monitor live matches what you analyze later.
- You can customize your display.
- ErgZone+ members can unlock and display additional advanced metrics for deeper analysis.
Where You’ll See Metrics
Metrics appear throughout the app — on your workout screens and in results.
You can display them during a workout using any of the three layout options:
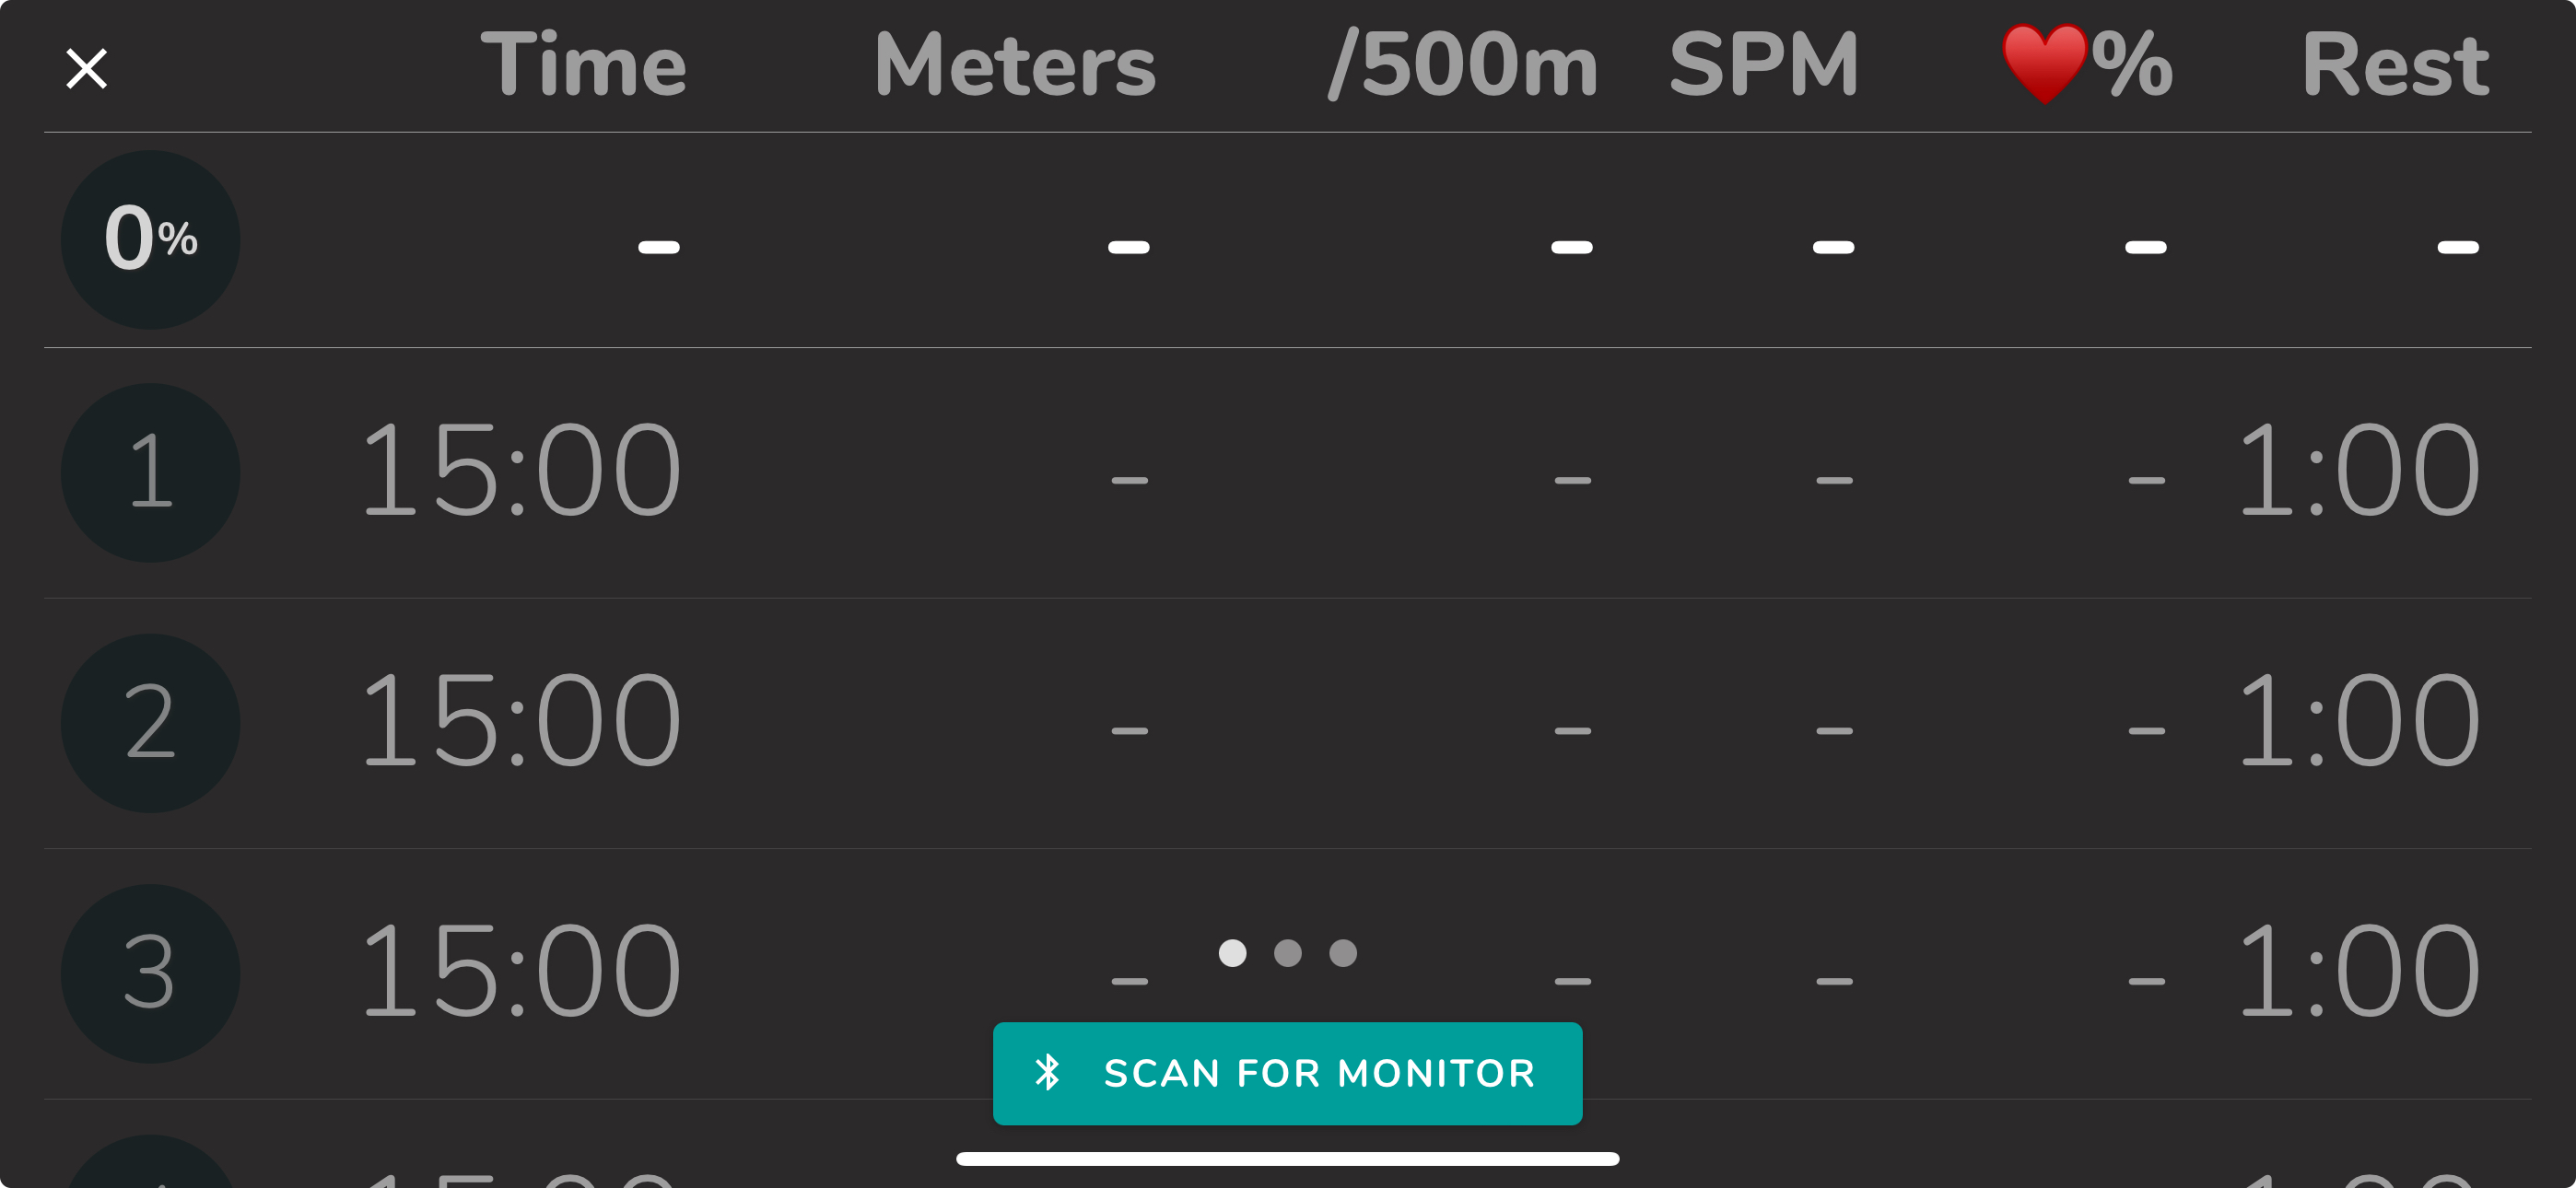
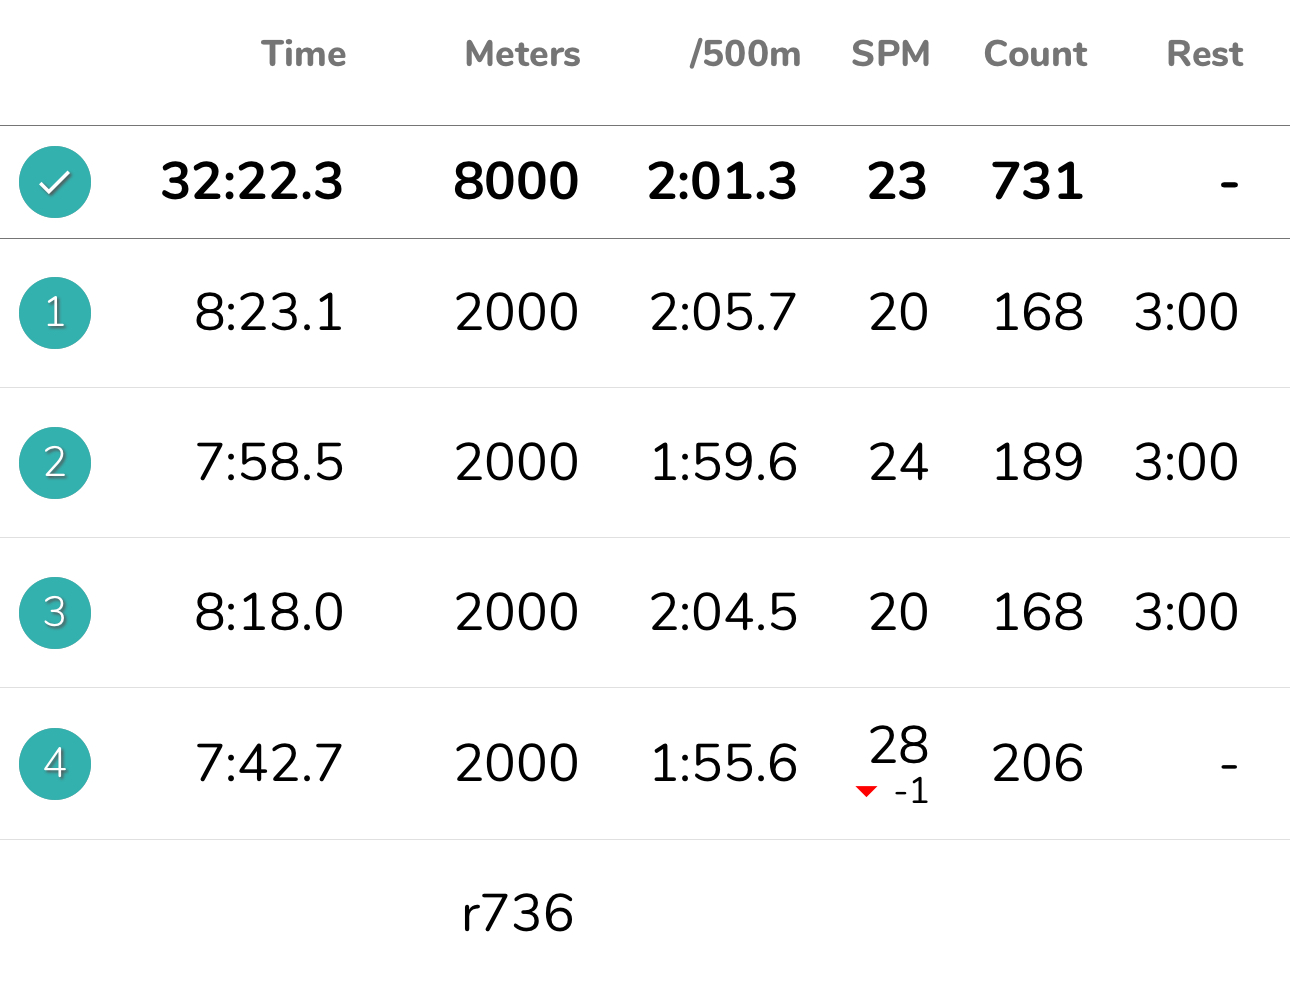
- Table View — best for detailed, data-rich tracking.
- Grid View — simpler layout with larger text and fewer numbers.
- Live Dashboard — great for viewing realtime results with others during group or remote workouts.
Metrics List
Time
As the name suggests, Time displays interval or workout durantion.
When looking at intervals, Time does not include rest periods.
To view time on the erg + rest, use Elapsed Time.
Learn more about Time here.
Elapsed (Time + Rest Time)
Elapsed stands for Elapsed Time, and it displays the total elapsed time since the beginning of the interval or workout.
Learn more about Elapsed Time here.
Projected Time🔒
Available during distance-based workouts, it displays the estimated time remaining until the conclusion of the interval and the entire workout (overall duration). This calculation is done based on the current pace.
Learn more about Projected Time here.
Rest
As the name suggests, Rest displays information pertinent to rest periods in mm: ss format.
Learn more about Rest here.
Meters
Displays the distance (in meters) overall and per interval.
Total Meters (Meters + Rest Meters)
Displays the distance (in meters) overall and per interval.
Projected Distance🔒
Available during time-based workouts, it displays the estimated distance until the conclusion of the interval and the entire workout (overall duration). This calculation is done based on the current pace.
Watts
Display wattage. The column watts will display the differentials if a suggested wattage is set for an interval. It includes the suggested watts and the difference between the suggested and actual.
Cal/hr
Calories per hour.
ErgZone doesn't calculate calories. Instead, it displays the calculation sent to the app by the PM5. PM5 uses a formula based on a 175-pound/79.5kg individual.
Cals
Calories.
ErgZone doesn't calculate calories. Instead, it displays the calculation sent to the app by the PM5. PM5 uses a formula based on a 175-pound/79.5kg individual.
Pace (/500m or /1000m)
Pace for 500m for row, ski.
Pace for 1000m for bike, fan bike, and run.
Km/h
Kilometers per hour.
MPH
Miles per hour
Heart Rate
ErgZone offers three (3) different ways of displaying heart rate.
- Avg ❤️ : Average BPM for the interval/workout.
- End ❤️ : Last BPM for the interval. Former ❤️.
- Min ❤️: Minimum recorded BPM (Beats per Minute) for the interval/workout.
- Max ❤️ : Maximum recorded BPM for the interval/workout.
- ❤️%: Average Heart Rate Percentage, calculated based on the Max HR set in Settings.
- E❤️%: Last BPM%, calculated based on the Max HR set in Settings.
- ⬆︎❤️%: Maximum BPM%, calculated based on the Max HR set in Settings.
- Zone: Displays Heart Rate Zone ring.
Count
Strokes Count displays the strokes (or revolutions) count for the interval or the workout.
DF (Drag Factor)
Displays the drag factor. To adjust it, change the damper on the erg.
SPI
Stroke Power Index.
MPH
Miles Per Hour
Km/h
Kilometers Per Hour
SPI% 🔒
Stroke Power Index Percentage.
It takes into account the SPI number configured in the Benchmarks..
SPI% 🔒
Stroke Power Index Percentage.
It takes into account the SPI number configured in the Benchmarks.
SPI 🔒
Stroke Power Index
Displays the SPI = watts/rate.
Max% 🔒
Maximum power percentage.
It takes into account the maximum power number configured in the Benchmarks.
Power% 🔒
Average power percentage.
It takes into account the maximum power number configured in the Benchmarks.
FTP% 🔒
Functional threshold power percentage.
It takes into account the maximum FTP configured in the Benchmarks.
Drive 🔒
The drive length is the length of your stroke. It is displayed in meters.
For instance, a drive length 1.24 translates to 1 meter and 24 centimeters.
DT / RT🔒
The Drive Time (DT) displays the duration of the drive in seconds.
The Recovery Time (RT) displays the duration of the recovery in seconds.
Force 🔒
Average force, displayed in pounds.
Peak 🔒
Peak Force.
It represents the top of the force curve, displayed in pounds.
Average Force 🔒
Available on Grid Mode only.
DPS 🔒
The distance per stroke, or "stroke distance," shown as DPS on ErgZone, is the distance accumulated during the “drive.
It is displayed in meters
It does not include the distance accumulated during “recovery.”
Ratio 🔒
The recovery-to-work ratio is presented as a numerical value with decimals.
For instance, a ratio of 2.7 translates to 2.7:1, indicating that there is 2.7 times more recovery than work in the given stroke.
On Concept 2, the PM5 calculates recovery time divided by drive time.
w/kg 🔒
Watts per kilo = wattage / kilos.
Curve 🔒
ErgZone displays the Force Curve stroke-by-stroke during a workout.
Upon completing each interval or split, it computes and presents an Average Force Curve specific to that section. This feature is not available on the PM monitor.
Available on Concept2 PM5 on the newer versions of PM5 (firmware 150 and older).
Delta 1 ( Δ1) 🔒
A Force Curve Delta 1 (∆1) offers a comprehensive view by displaying two power curves:
- The current stroke's force curve appears in teal.
- The force curve from the previous strokes appears in orange.
The intersection of these teal and orange curves is highlighted in vibrant neon green.
This is a feature not available on the PM monitor.
Delta 5 ( Δ5) 🔒
A Force Curve Delta 5 (∆5) offers a comprehensive view by displaying two power curves:
- The current stroke's force curve appears in teal.
- The force curve average from the previous 5 strokes appears in orange.
This is a feature not available on the PM monitor.
Force Efficiency 🔒
Force Effience = Average Force / Peak Force.
The closer to 100%, the better. This is a metric in beta.
This is a feature not available on the PM monitor.
Force Efficiency is available on Grid View and Live View.