Workout: Grid View
As listed in the Workout Screen article, athletes can view their real-time metrics on the ErgZone app in 3 formats: Table View, Grid View, and Live View.
In the article, we will dive into the Grid View.
Opening the Grid View
When connecting a workout to the PM5, the ErgZone app will open the workout screen in the Table View mode. Swipe left to move to Grid View mode.
Grid View Mode Explained
The Grid View displays:
- a list of intervals or splits on the top of the screen with a progress bar;
- 8 metrics: 2 large on the middle and 3 medium on each side.
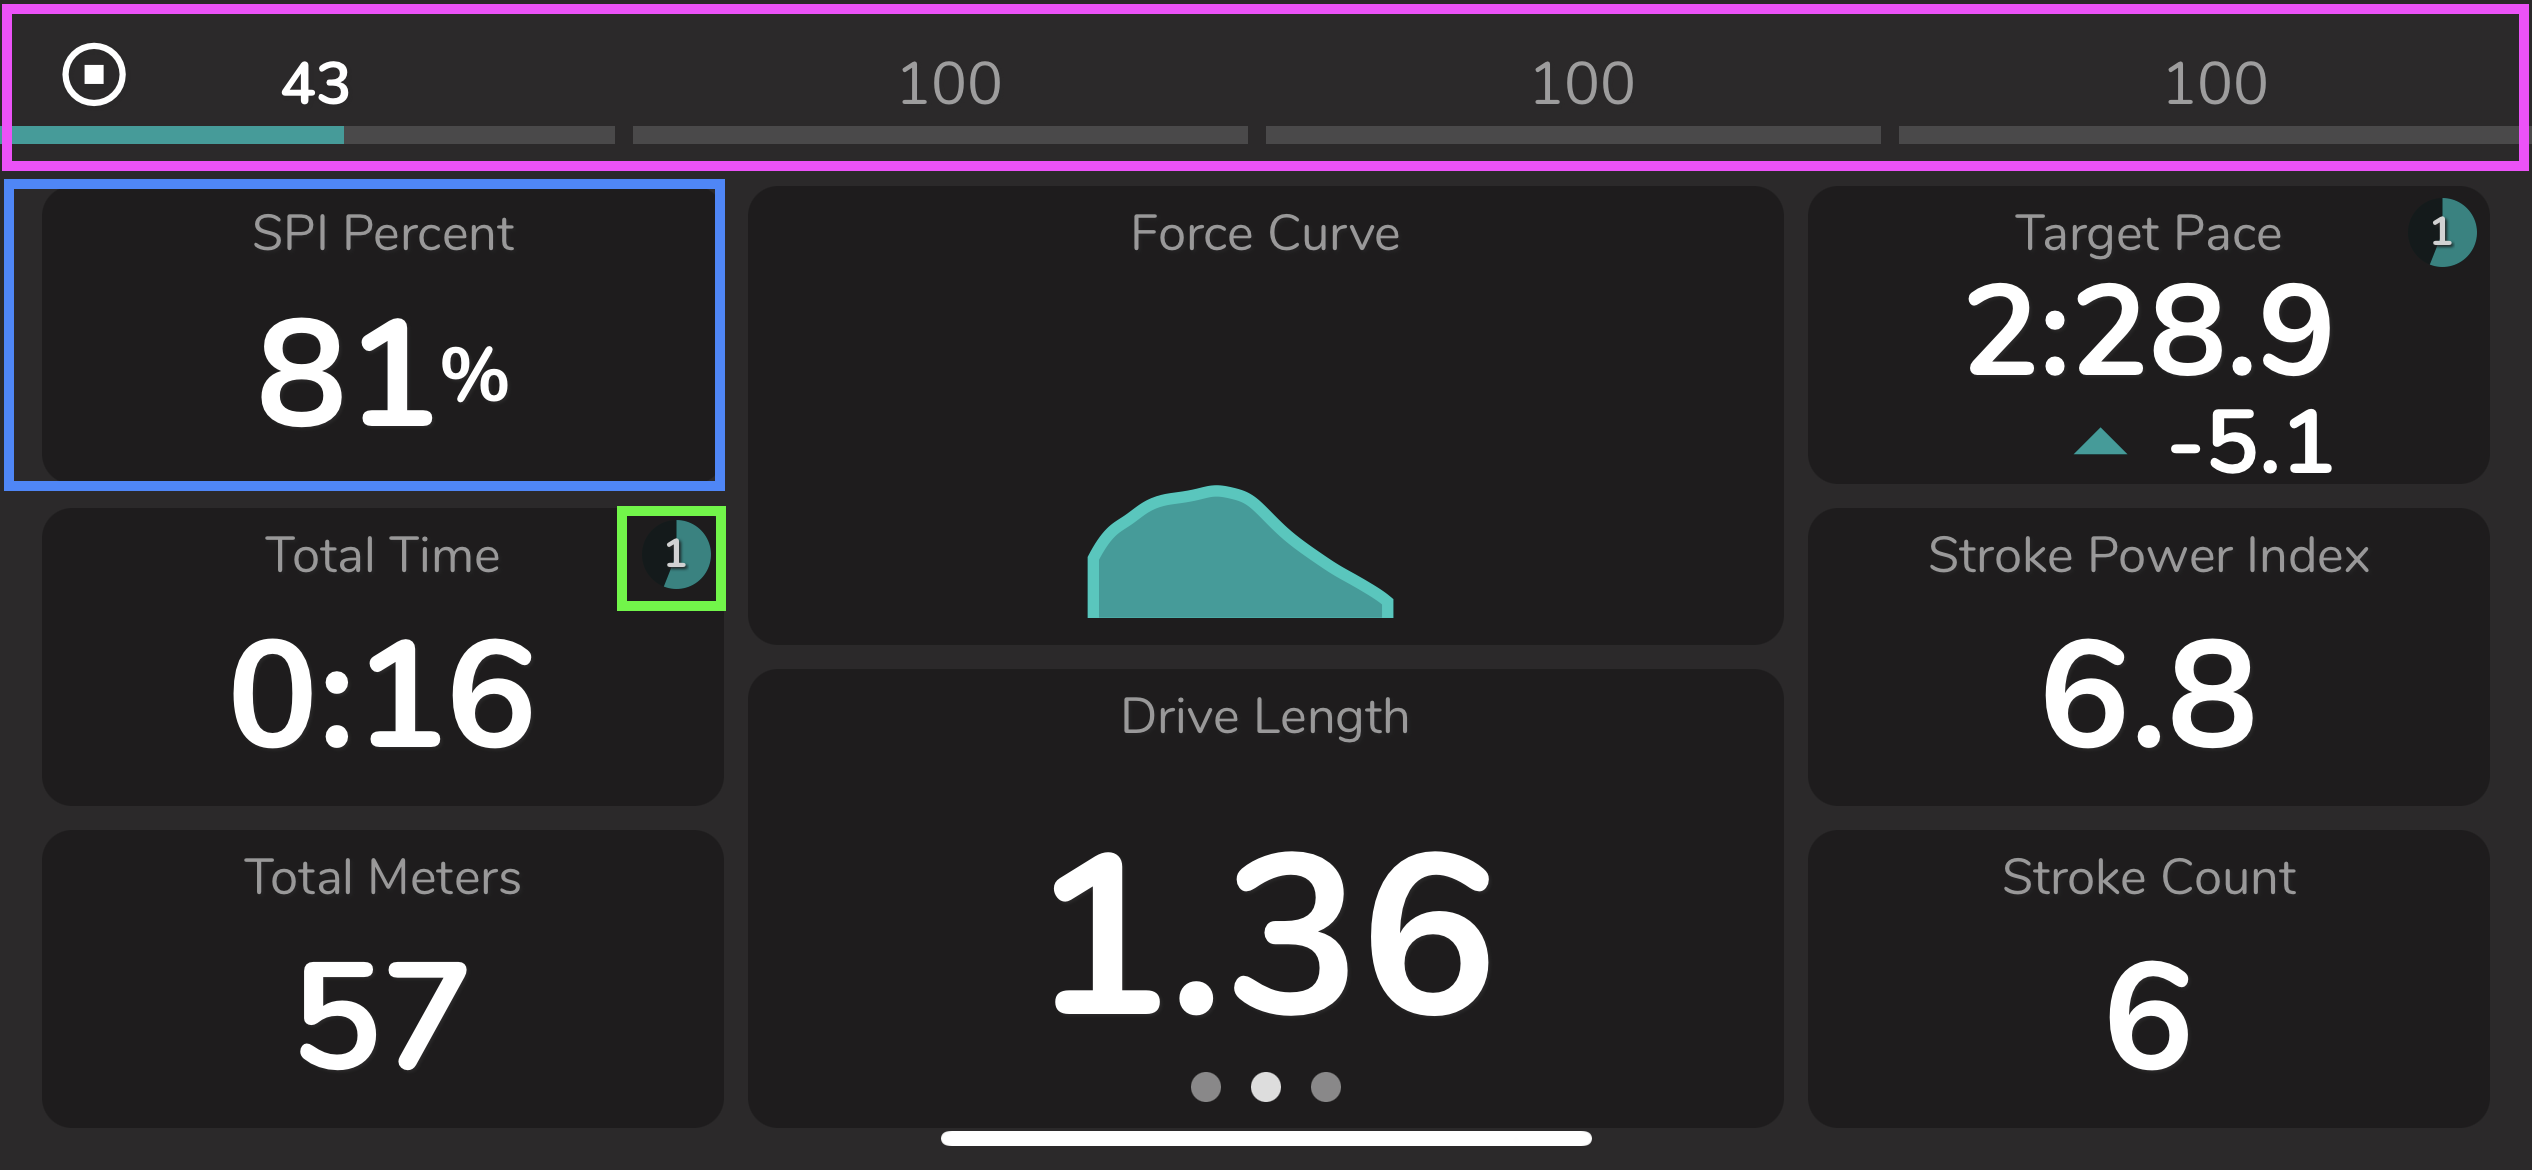
Progress Data (pink box)
A list of intervals or splits and their lengths is displayed on the top of the screen. Each segment will change colors from gray to teal to display the progress.
In the example above, each interval is 100 meters long.
Tiles (blue box)
Athletes can customize which metric will be displayed in each tile.
Certain metrics offer a choice between two options:
- Current: Show data for the ongoing stroke;
-
Interval: Show the accumulated data for the current interval.
When presenting data for the interval, a circular progress bar will appear within the tile, signifying the interval or split number (green box).
Altering Metrics on Grid View
- Click on the tile;
- Select the metric from the list
- Click on the dropdown to select "Current" or "Interval."
-
Click "X" or outside the metric selection screen to close the modal.

