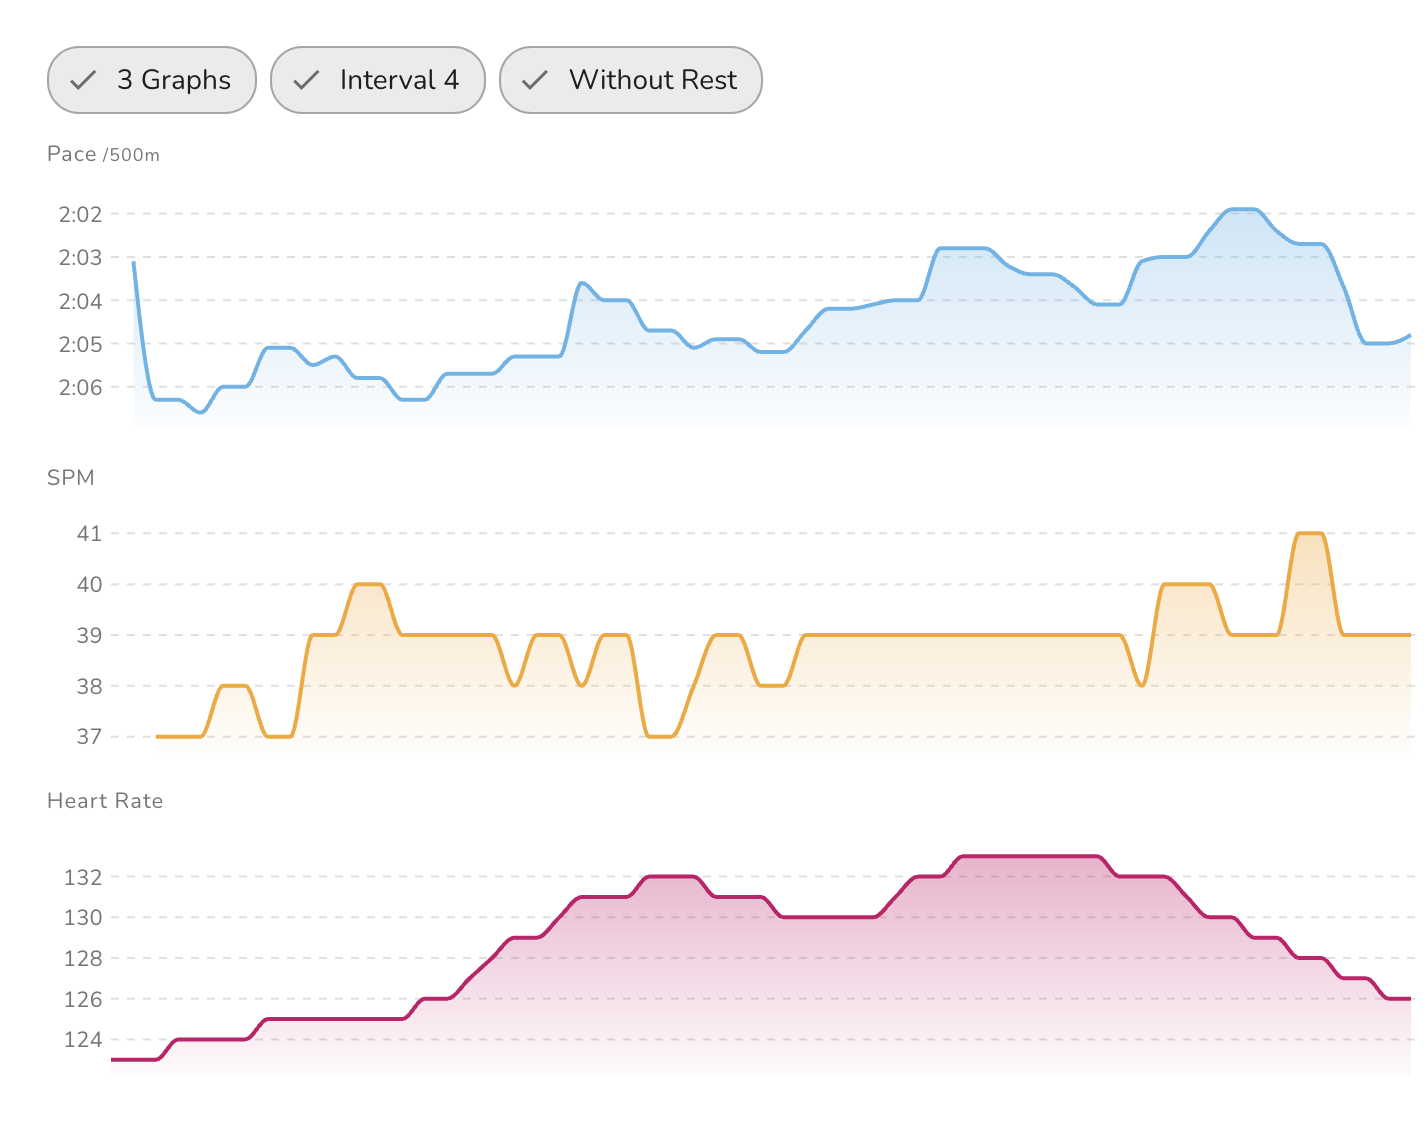
Understanding Workout Graphs on ErgZone
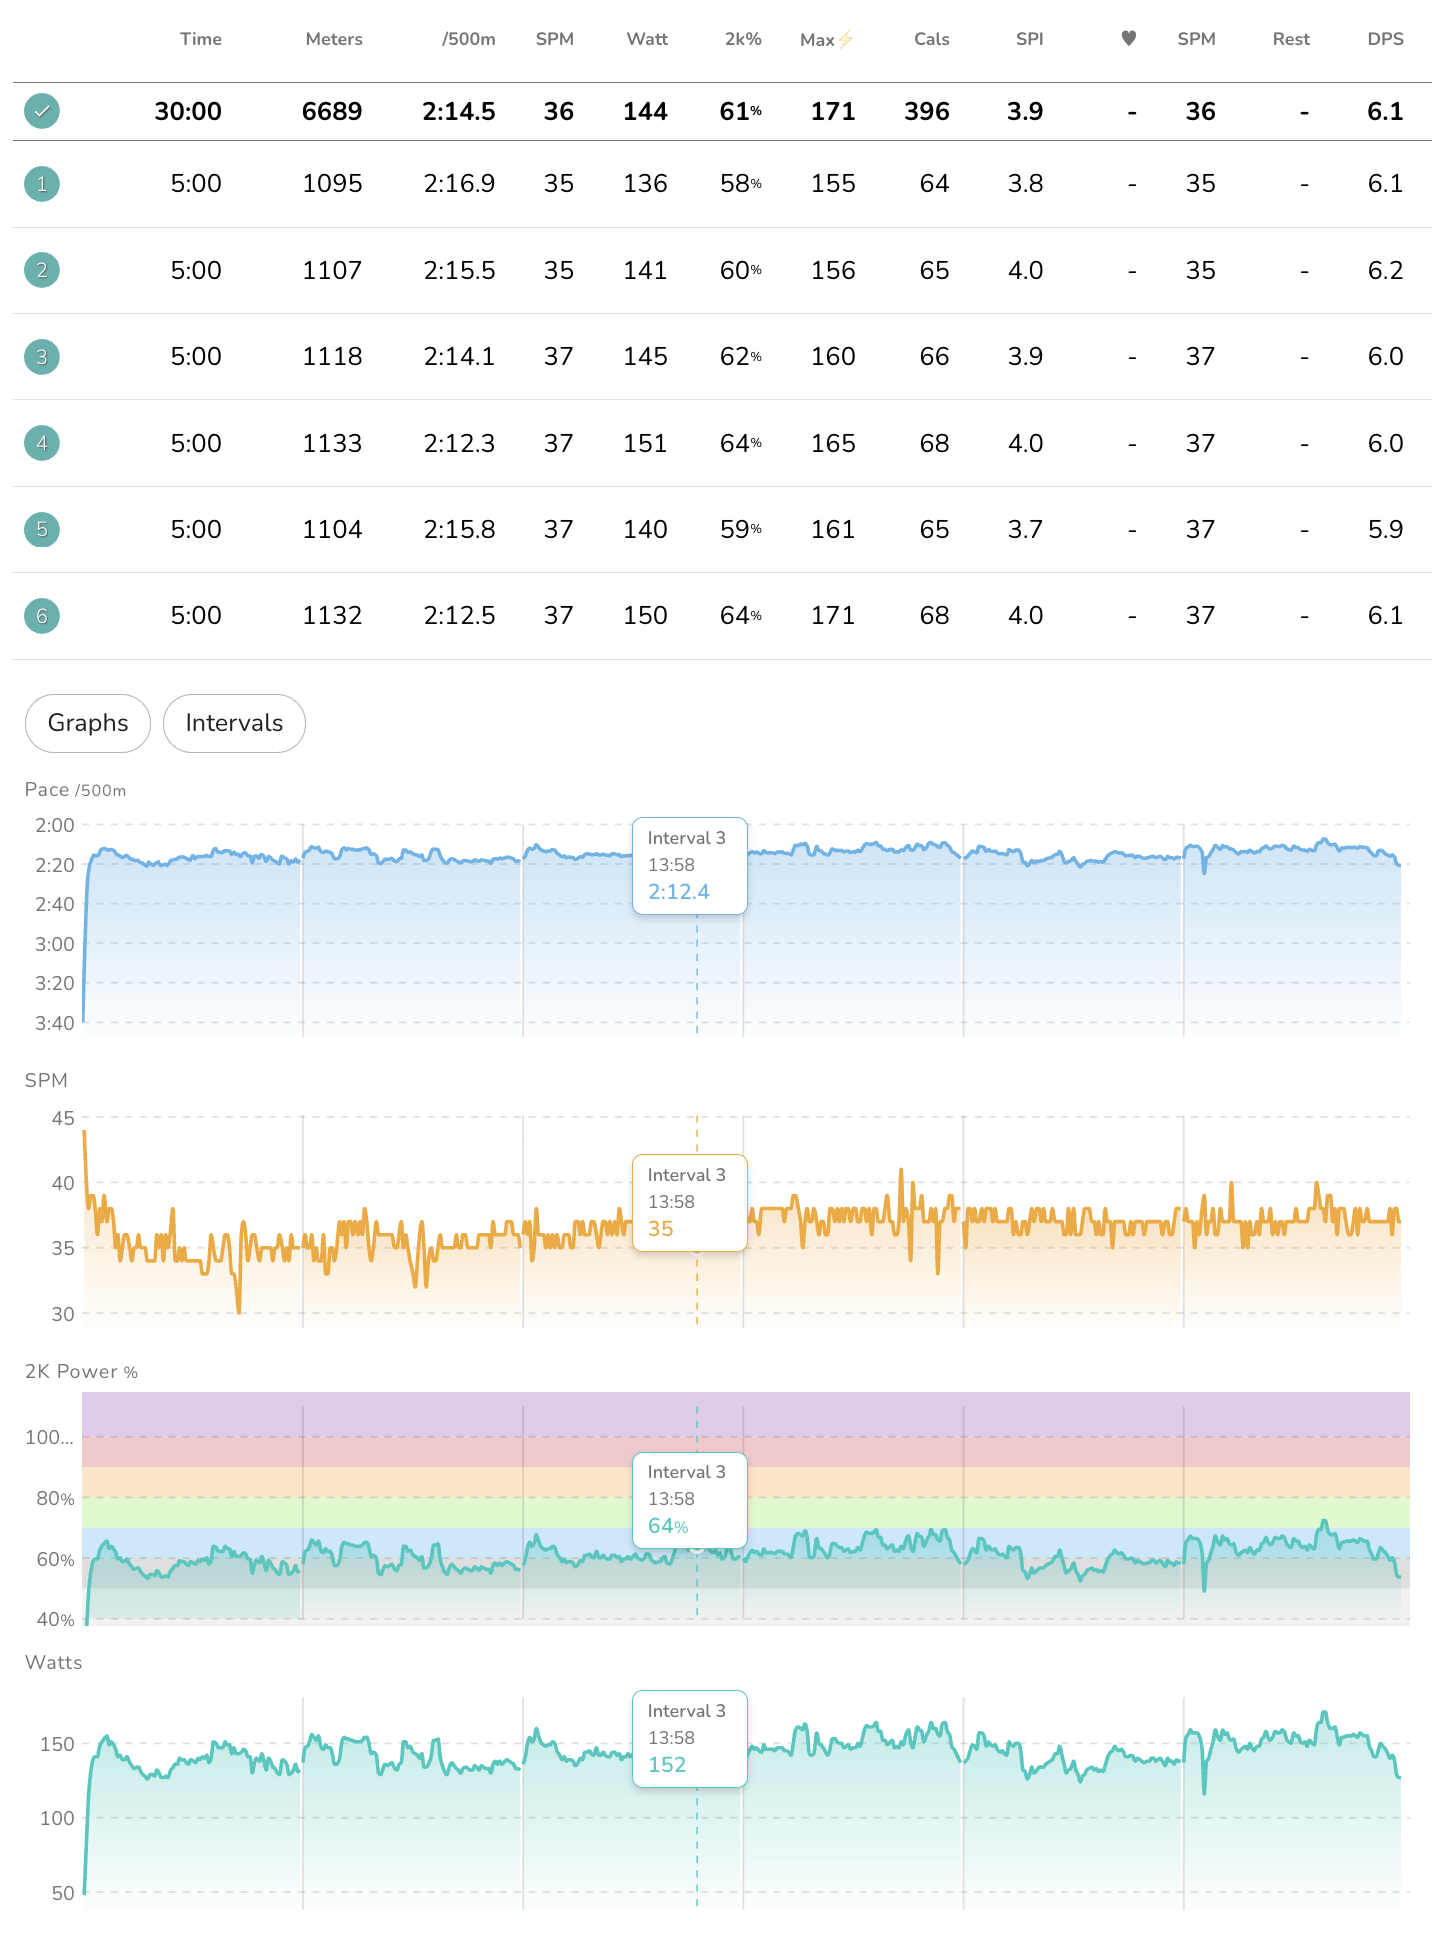
ErgZone provides athletes and coaches with detailed result tables that capture essential totals, averages, and split times for every session. To complement these numbers, ErgZone features interactive Workout Graphs, giving you a complete visual picture of your performance alongside your workout data.
How Graphs Enhance Your Workout Data
While summary tables give you accurate averages and final numbers, graphs plot your performance along a continuous timeline. This visual representation brings your table data to life, allowing you to see exactly how your evolved throughout your workout.
-
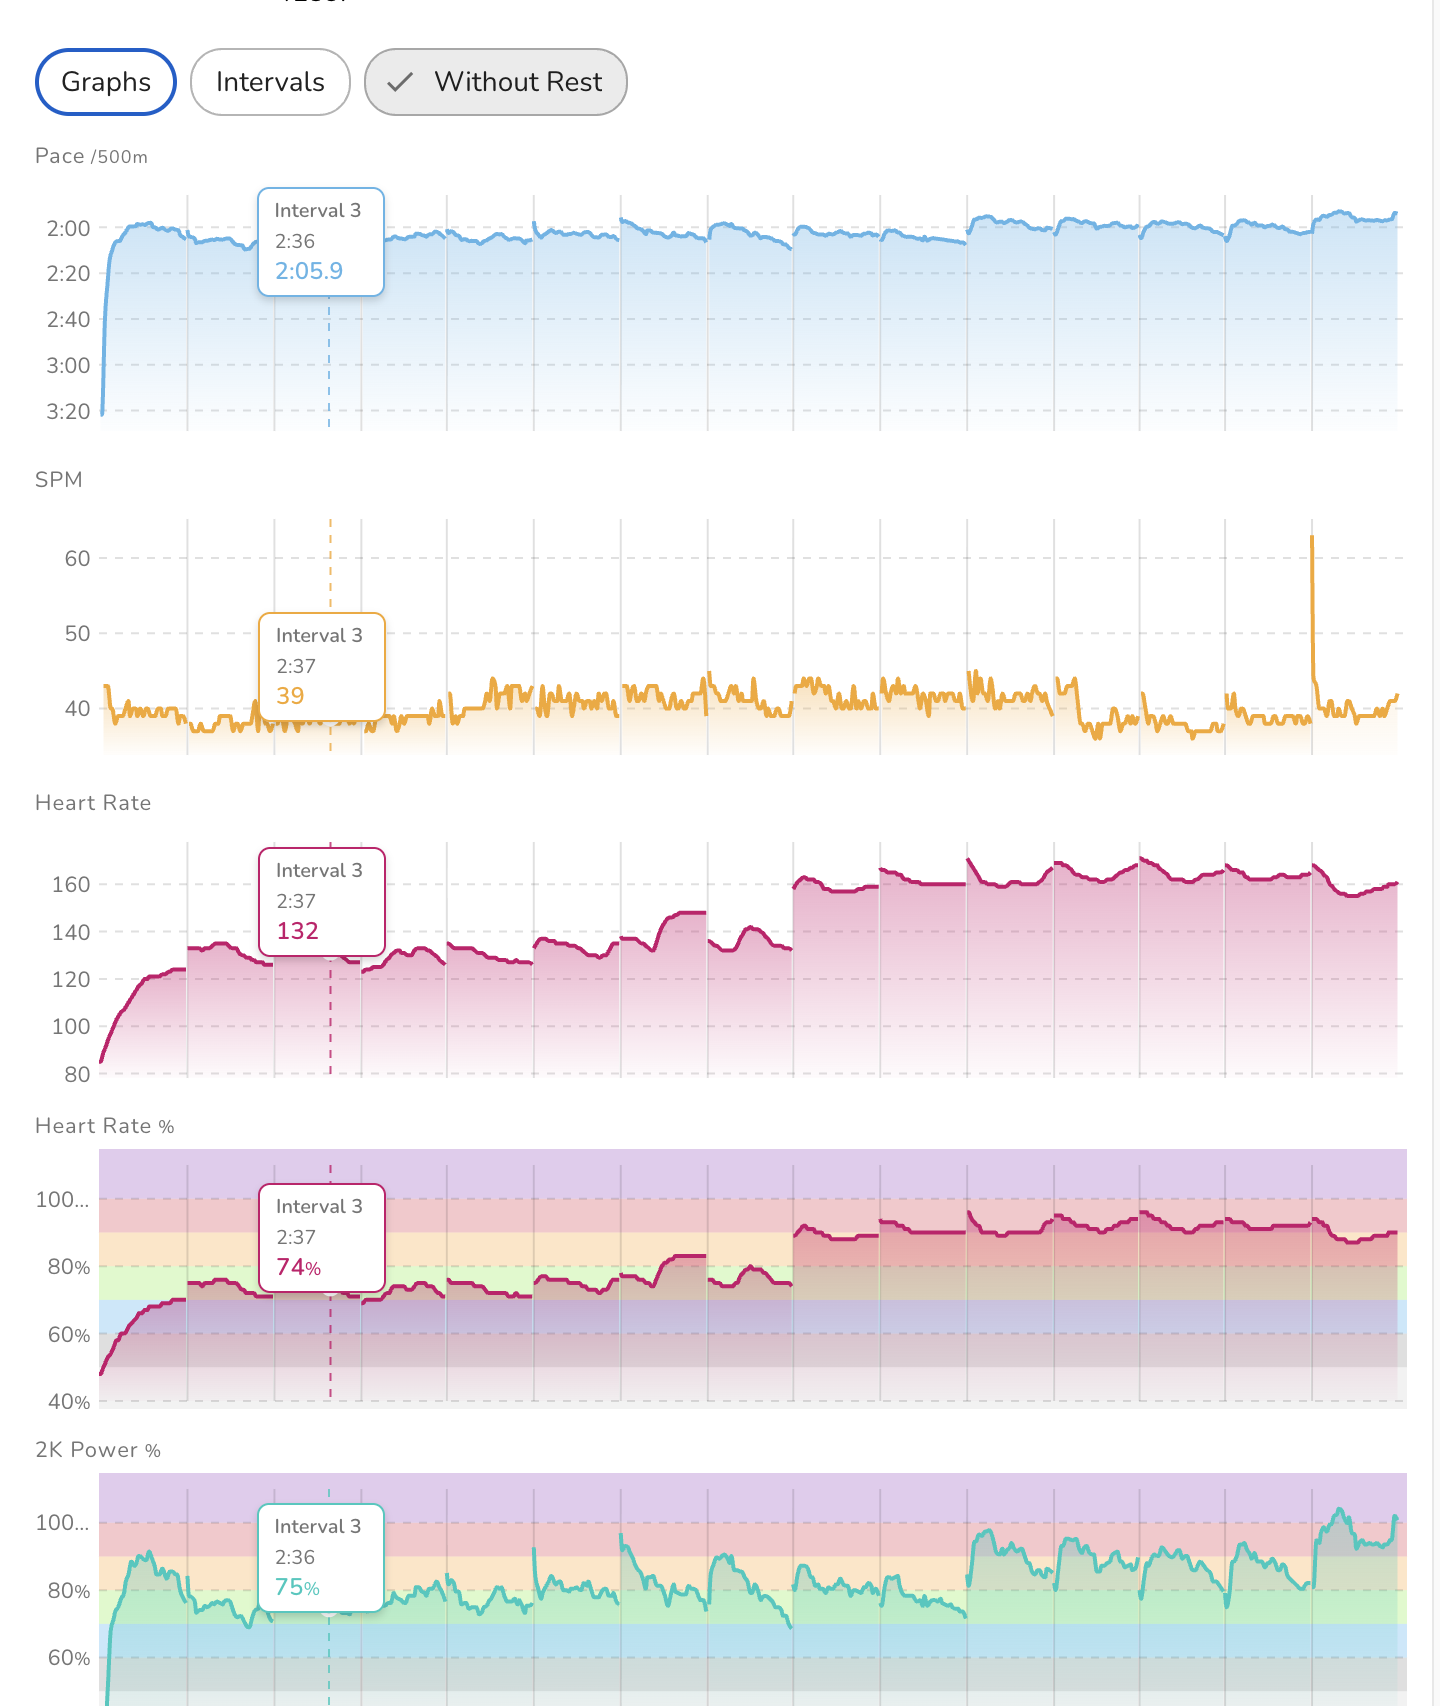
Interactive Timeline: Swipe across any graph to inspect specific moments in your workout; the scrub line dynamically syncs across all open graphs to display your exact metrics for that exact timestamp.
-
Aligned Context: View your selected metric graphs stacked vertically below your summary table, sharing the exact same timeline for easy comparison.
-
Moment-by-Moment Detail: Spot subtle shifts in effort, power drops, or heart rate spikes that averages alone might smooth over.
-
A Complete Picture: Combining tables and graphs gives you both the high-level numbers for quick tracking and the detailed visual story for deep performance analysis.
Where to Find Your Graphs
Your graphs are generated automatically and can be accessed across ErgZone and Web Admin:
In ErgZone:
- Post-Workout Summary: View your graphs immediately after completing a workout on the post-session summary screen.
- Past Workout Results: Access graphs anytime by opening past workout results from your history.
- Shareable Screenshots: Any graphs enabled in your view are automatically included when generating screenshots in the app to share with coaches or on social media.
In Web Admin:
- Web Admin Dashboard: Review and analyze the same graphs available in the app directly on the Web Admin panel.
Available Graph Options
Graphs are stacked vertically on identical timelines, making it easy to compare how different aspects of your performance interact.
Default View
- Pace / Split Time
- Stroke / Cadence Rate
- Heart Rate (HR)
Additional Graph Options
- Power: Watts, Power%, Max Power %
- Heart Rate: HR%
- Movement Dynamics: Drive Length, Distance per Stroke, Drive Time, Recovery Time, Average Force
- Machine Metrics: Drag Factor
Note: The specific graphs available for your workout depend on your machine, erg type, manufacturer, monitor model, and any connected sensors (such as a heart rate monitor).
Filtering & Interval Deep Dives
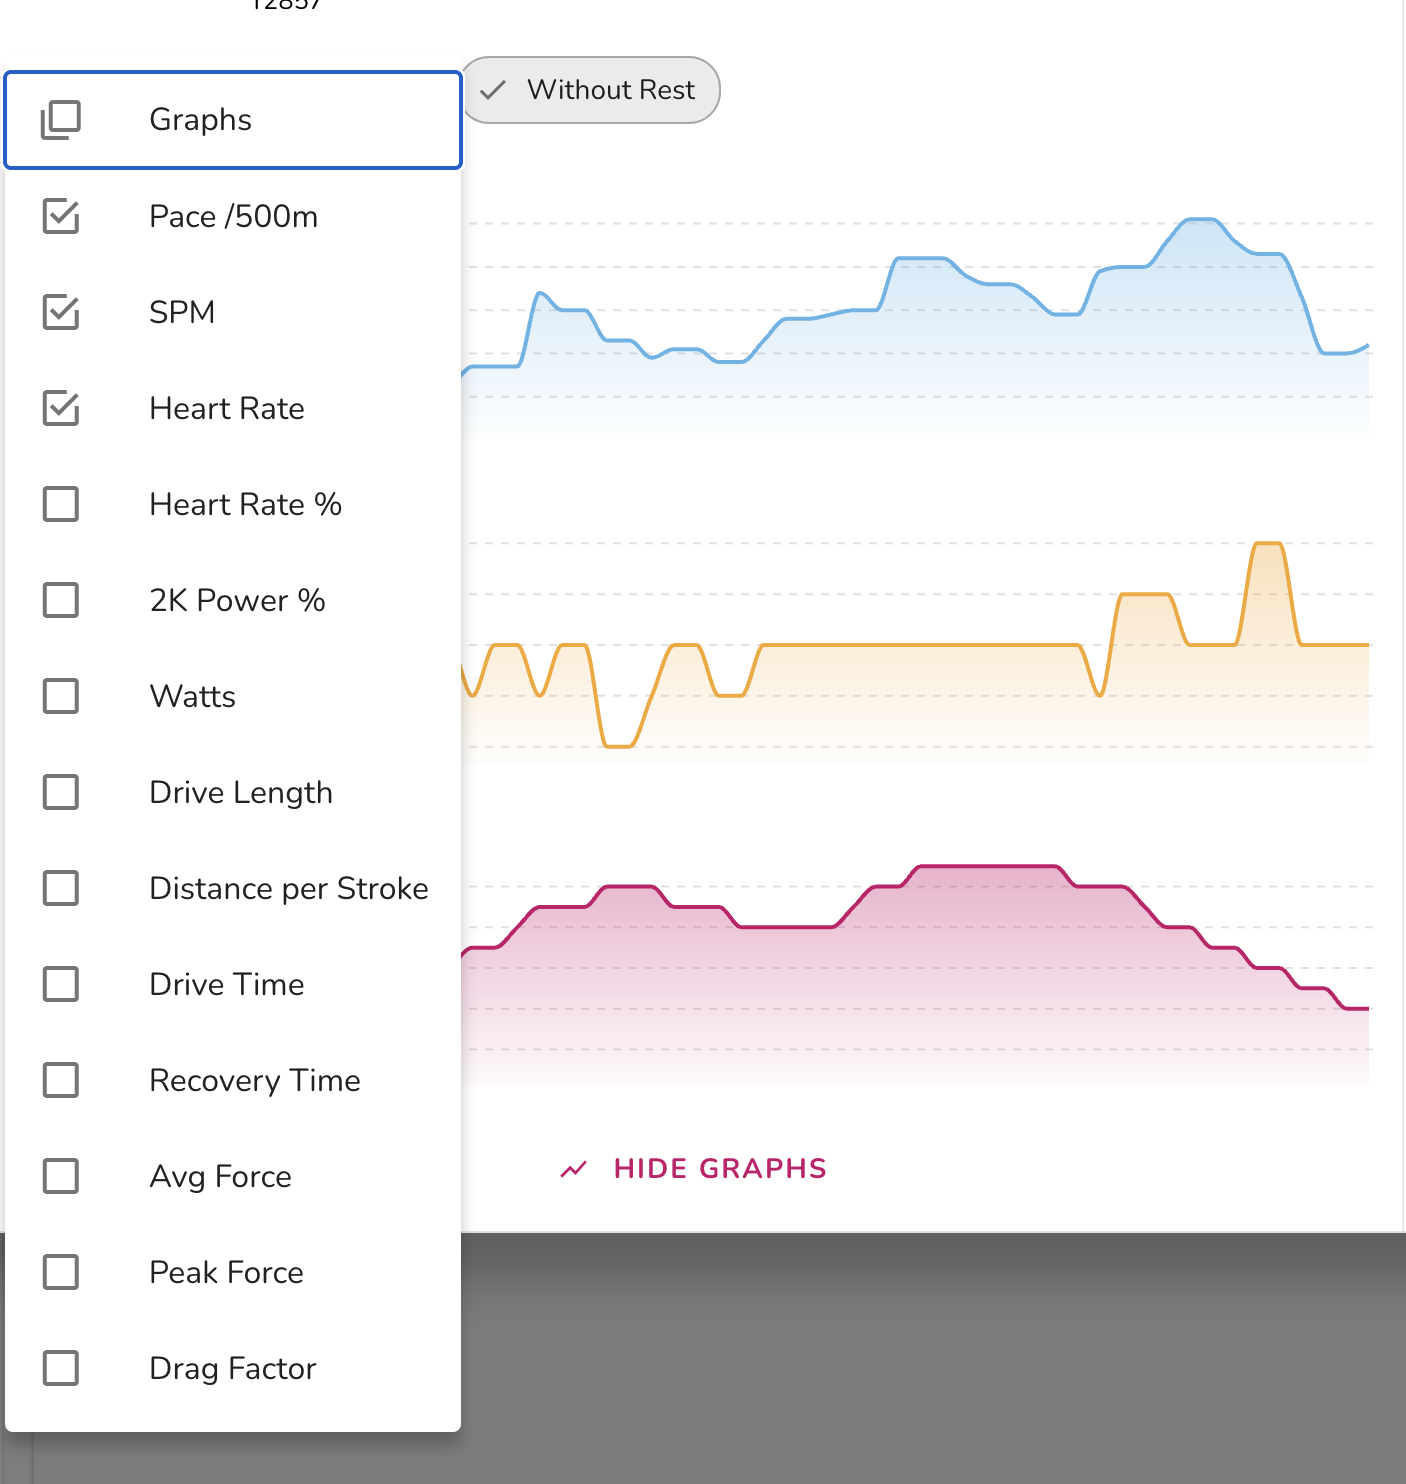
You can easily adjust your graph view to focus on the specific data points that matter most for your session:
-
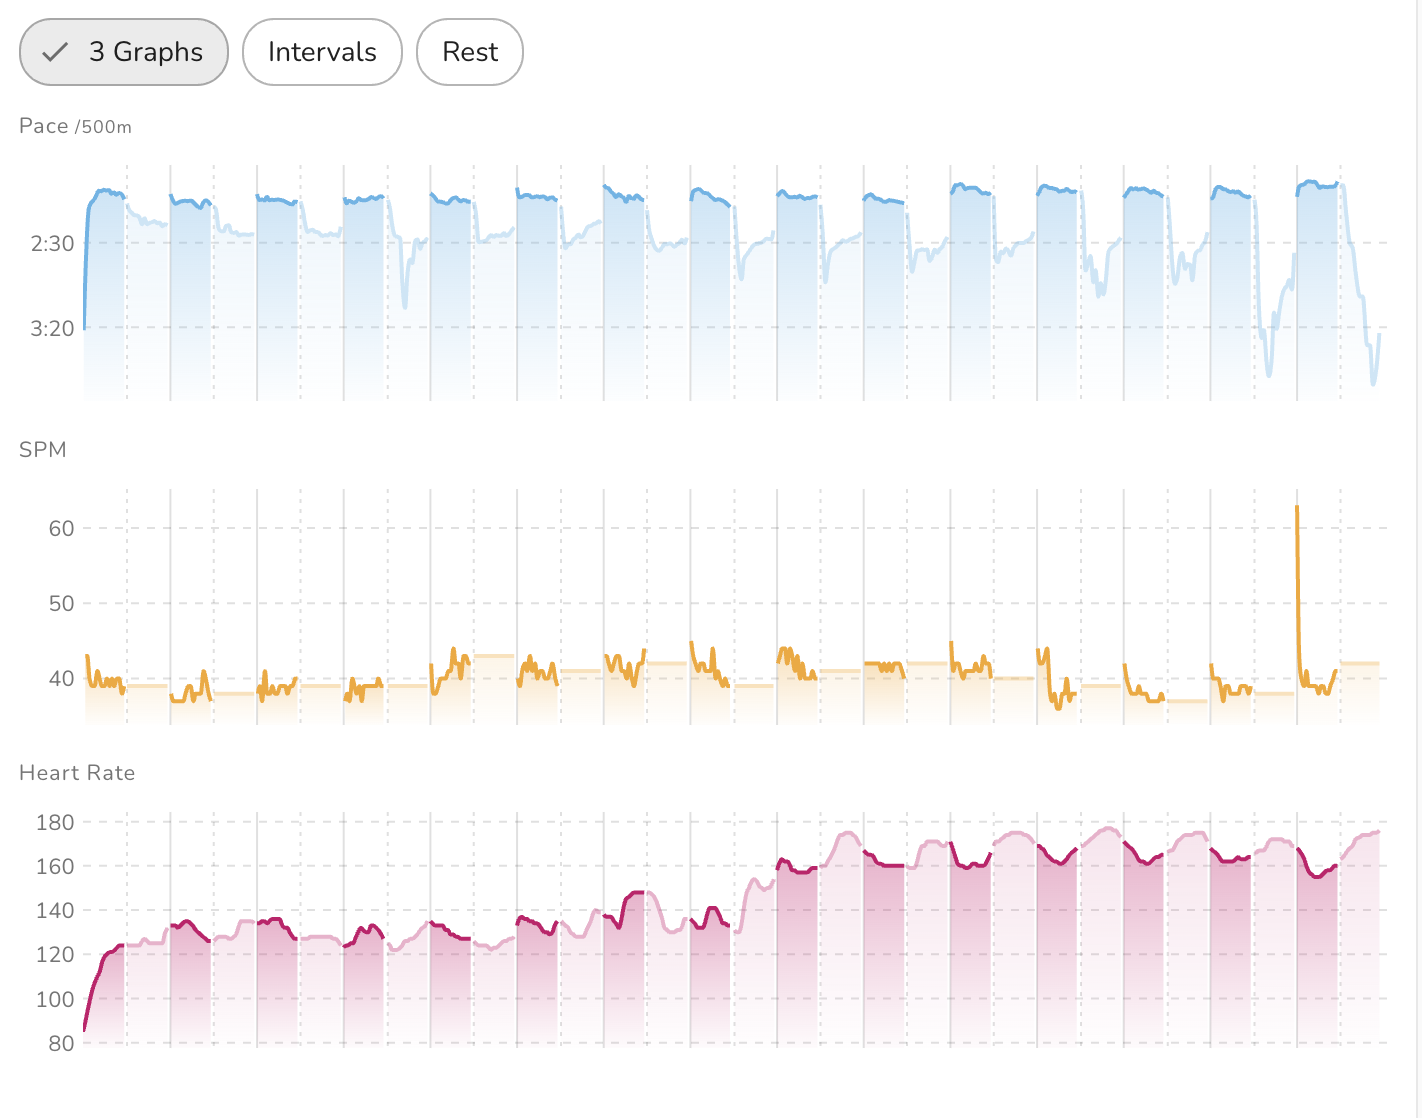
Full Workout View: See your entire workout from start to finish, including active work and rest intervals.
-
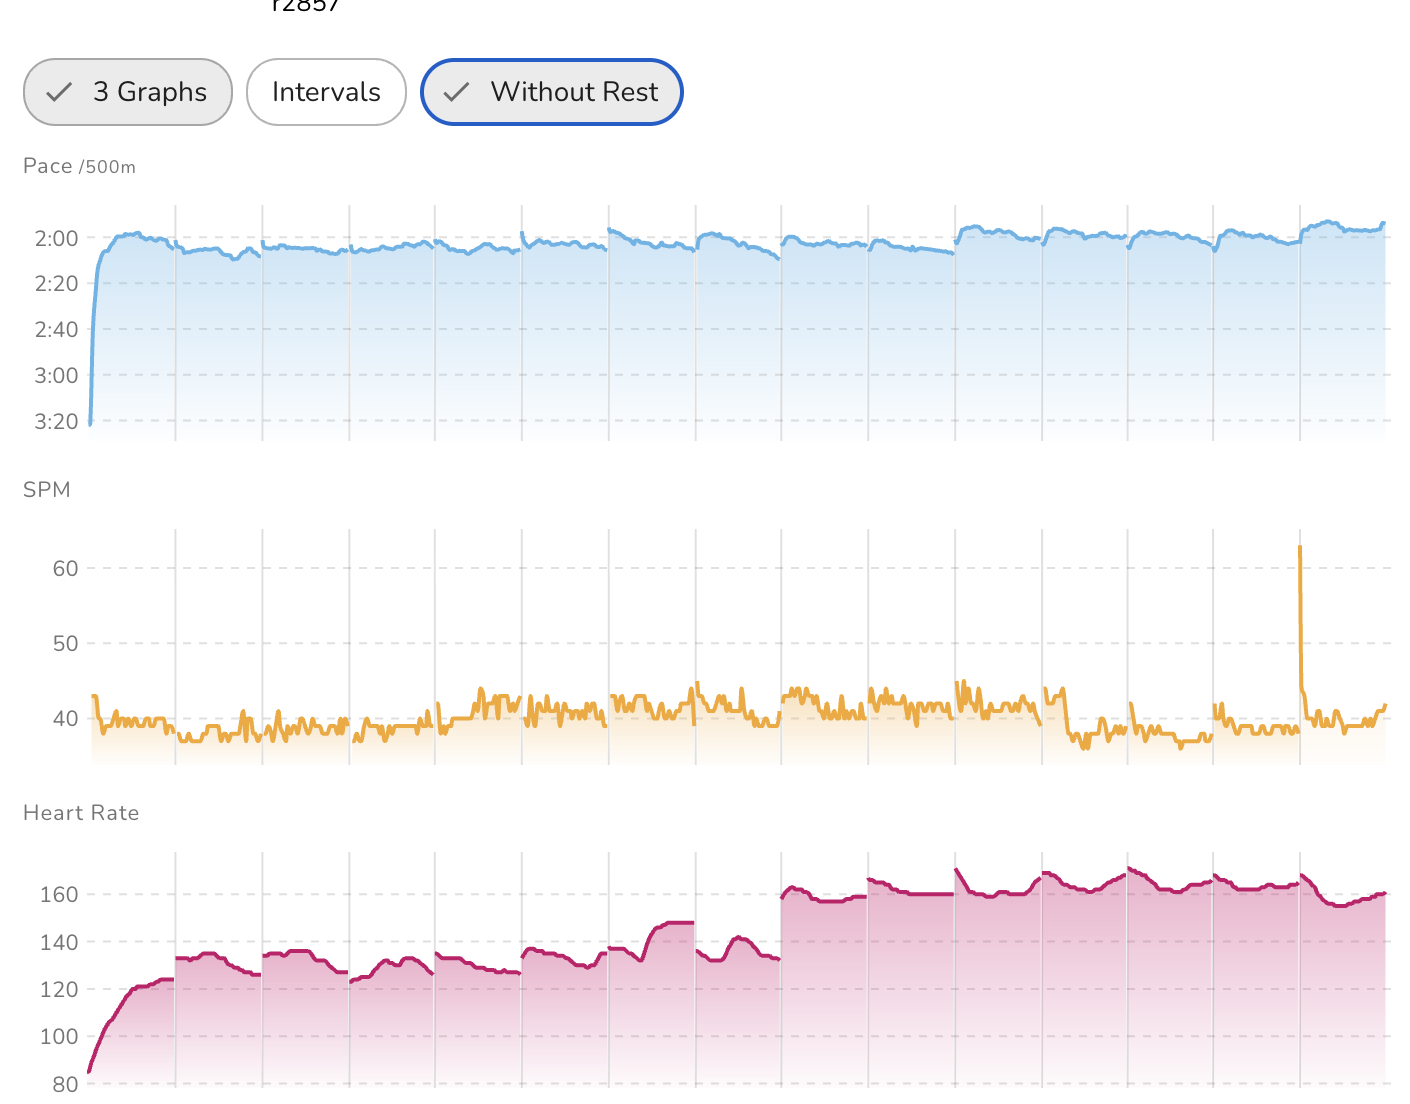
Filter Out Rest: Toggle off rest periods to view continuous work data without downtime gaps.
-
Single Interval Focus: Tap any individual interval in your result table to zoom directly into that segment's graph, making it easy to check split targets and pacing consistency during high-intensity efforts.